


A Brief History of Predictive Analytics – Part 1
This is part 1 of a 3-part blog, where we outline the history of Predictive Analytics. Given it is such a hot topic with our warranty manufacturing clients – as well as just about any company looking to drive higher efficiency, profitability and customer satisfaction – we thought a quick history lesson might be warranted (pun intended). Part 1 takes you from the 1940’s – 1950’s, Part 2 from the 1960’s – 1990’s, and Part 3 from the 2000’s – today.
Introduction
Predictive analytics has been around for over 75 years, but just recently hit mainstream status. It is currently being utilized across industries and functional areas, for such things as: insurance underwriting, fraud detection, risk management, direct marketing, upsell and cross-sell, customer retention, collections, at-risk patient determination, and so much more.
Adoption is being driven by two key factors 1) the explosion of data – both structured and unstructured – inside and outside corporate walls, and 2) a plethora of new technologies that make it easy and affordable to store, clean, combine, explore, and visualize the data in real-time. To understand how predictive analytics is impacting – and will impact – organizations like yours, it is valuable to see how we got here.
Figure 1 – Evolution of Analytics
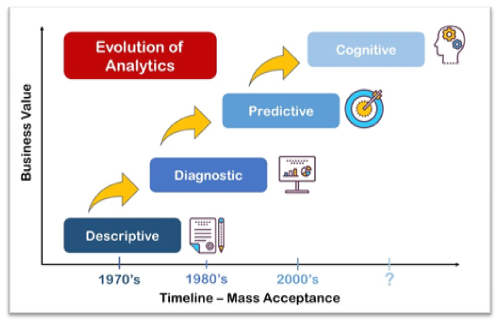
Source: After, Inc., 2018
Figure 1 is a slight alternative to the Gartner Analytics Maturity Model that has been used for years to describe the evolution of analytics. Gartner’s model has the following four phases:
- Descriptive (what happened?) – the most basic form of analytics that illustrates historical trends
- Diagnostic (why did it happen?) – the next level up which allows users to dig deeper and uncover root causes
- Predictive (what will happen?) – the development of mathematical algorithms using weightings and scores to make predictions about the future; utilizes techniques from data mining, statistics, modeling, machine learning, and artificial intelligence
- Prescriptive (what should I do?) – the application of recommendations based on predictive insights
Our graphic excludes “Prescriptive Analytics” as a separate phase, because we see it as a natural extension of “Predictive Analytics” – as insights should naturally lead to recommendations. In its place, we have “Cognitive Analytics”. Deloitte defines Cognitive Analytics as “a field of analytics inspired by how the human brain processes information, draws conclusions, and codifies instincts and experience into learning.” Deloitte predicts that cognitive analytics will “push past the limitations of human cognition, allowing us to process and understand big data in real time, undaunted by exploding volumes of data or wild fluctuations in form, structure, and quality (Source: Deloitte, “Cognitive Analytics – Tech Trends”, 2014)”.
While we believe that Cognitive Analytics will someday (soon) mature and change the shape of industries like government, healthcare, and manufacturing, we aren’t there yet. But we agree with Deloitte and other BI analysts that, at some point, machines will work alongside us, helping us to solve some of our world’s toughest strategic questions.
The Early 1940’s –the First Computers
- Key Players:
- Government Agencies
- Significant Events:
- In 1940, Alan Turing developed the Bombe machine to decode the German’s Enigma communications during WW2 – the precursor to the computer.
- From 1939-1945, the Manhattan Project team utilized Monte Carlo simulation (manually) to predict the behavior of atoms during a chain reaction – the result being the creation of nuclear bombs. These bombs, made out of uranium and plutonium, were dropped on Hiroshima and Nagasaki during WW2.
- Innovations:
- Linear programming – a mathematical technique used in computer programming to determine the best possible outcome or solution from a given set of parameters or list of requirements, represented in the form of linear relationships.
- Computational modeling – use of computers to simulate and study the behavior of complex systems using mathematics, physics and computer science.
- Monte Carlo simulation – a technique for estimating a variable which depends on one or more random factors (as opposed to a deterministic variable, which depends only on fixed inputs, from which a fixed value can be calculated). It is a technique used to understand the impact of risk and uncertainty in prediction and forecasting models.
The 1950’s: Analytics in Research Organizations
- Key Players:
- Research Organizations
- Significant Events:
- In 1950, the ENIAC (Electronic Numerical Integrator And Computer) ran a set of mathematical equations to predict the air flow in the upper levels of the atmosphere, leading to the use of computers to help forecast the weather.
- In 1951, Swedish mathematician Weibull published a paper explaining continuous probability distributions, used to assess product reliability, determine mean life, probability of failure at a specific time and estimate overall failure rates. This analysis is extremely valuable in warranty analytics.
- Punch cards were developed to store computer generated data – and by the 1950’s, were being widely used by businesses and governments.
- The hard disk drive (HDD), introduced by IBM in 1956, weighed over a ton and was the size of a refrigerator. With 3.75 MB of storage, the first hard disk drive (HDD) had enough storage space to hold an mp3 file, 45 seconds of low-res video, or 5 million characters of text.
Figure 2 – Dijkstra’s Algorithm
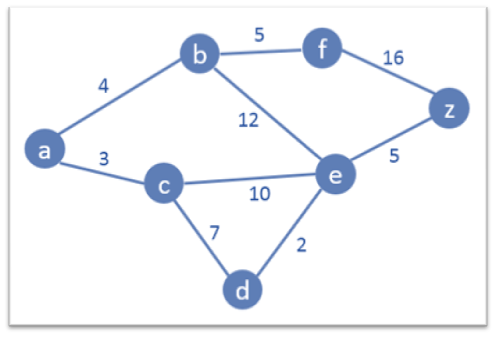
- In 1959, Dijkstra published an algorithm for finding the shortest paths between nodes in a graph (see Figure 2), which could represent, for example, airports or road networks.
- Innovations:
- Nonlinear programming – the process of solving an optimization problem defined by constraints, over a set of unknown variables, along with an objective function to be maximized or minimized, where some of the constraints or the objective function are nonlinear (e.g. 3X is a linear term, 3X² is nonlinear).
- Computer-based heuristic problem solving – where finding an optimal solution is impossible or impractical, heuristic methods can be used to speed up the process of finding a satisfactory solution. Examples that employ heuristics include using a rule of thumb, an educated guess, an intuitive judgment, a guesstimate, stereotyping, profiling, or common sense.